

The InnoBooks Profitability suite brings together four reports —
Profitability Summary,Profitability Detail,Team UtilizationandRetainer Summary— to measure your margins by client and by project, from tracked time and assigned expenses. Each report filters by date and exports to CSV or PDF.
What you’ll need
- The
profitability.readpermission (andreports.readfor theReportspage). - Tracked time (timesheets) and expenses assigned to your projects and clients, otherwise costs and margins stay at zero.
- Labor rates configured, and for retainers, an hours budget set on the project.
Steps
- Open the Profitability suite
Open
Reportsfrom the menu, then find theProfitability Reportsgroup. It holds four cards:Retainer Summary,Team Utilization,Profitability SummaryandProfitability Detail. This group appears only if your role hasprofitability.read.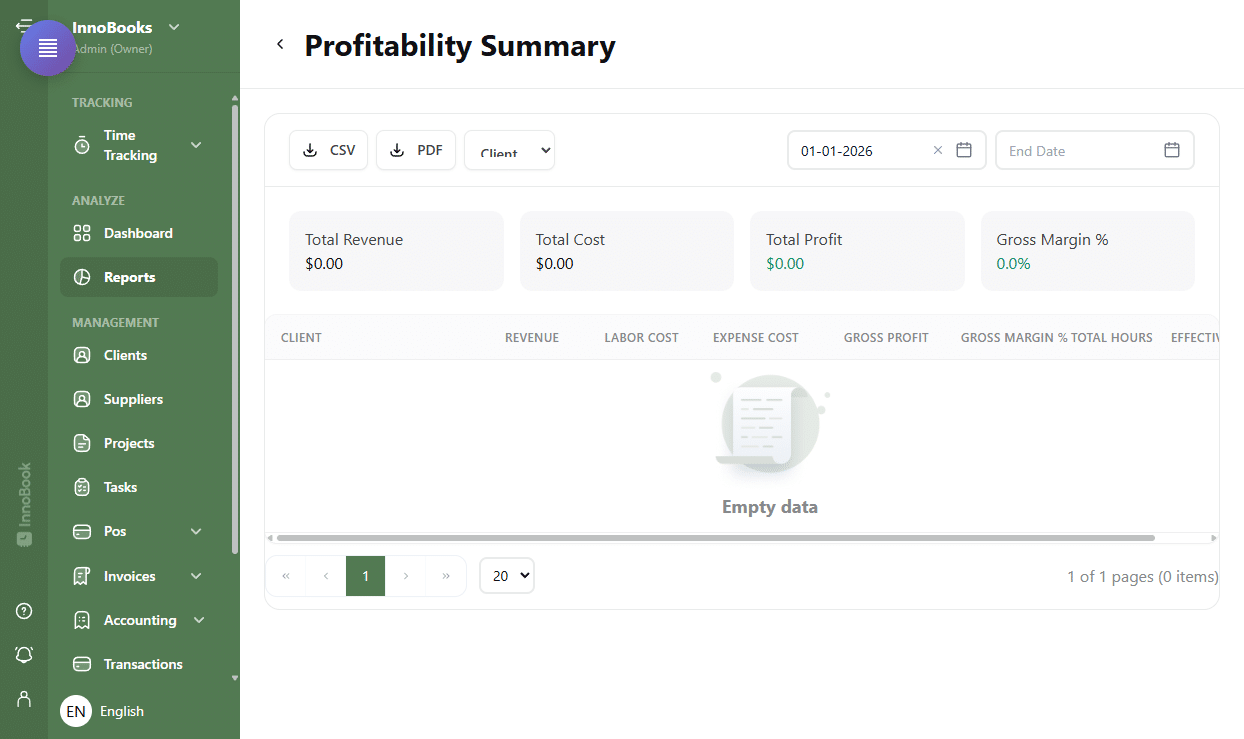
Profitability Reports group on the Reports page, with its four cards. - Read the Profitability Summary
Open
Profitability Summary. At the top, choose the grouping —ClientorProject— and a date range (Start Date/End Date). Four cards recap the whole:Total Revenue,Total Cost,Total ProfitandGross Margin %. The table breaks it down per row: Revenue,Labor Cost,Expense Cost,Gross Profit,Gross Margin %,Total HoursandEffective Rate. - Explore the Profitability Detail
The
Profitability Detailreport shows the same four totals, then a list of expandable projects. Click a project to see its lines:Type(Labor or Expense), Date, Description,Team Member,Total HoursandAmount. This shows exactly what makes up each project’s profit. - Measure team utilization
The
Team Utilizationreport shows how busy each member is. Top cards:Total Members,Billable Hours,Avg UtilizationandBillable Revenue. The table gives, per person:Total Capacity,Billable Hours,Non-Billable Hours,Total Tracked,Utilization %andBillable Revenue. Utilization turns green at 80% and up, red below 50%. - Track retainers
The
Retainer Summarytracks hours-retainer projects. Top cards:Total Projects,Total Budget(hours),Avg UtilizationandTotal Overage. Per project, the table shows the period,Hours Budget,Hours Consumed,Hours Remaining,Utilization %,Retainer ValueandOverage Value. Negative remaining hours and any overage show in red. - Filter, sort and export
On each report, adjust the date range with
Start DateandEnd Date(the summary opens by default on January 1 of the current year). In the tabular reports (Profitability Summary,Team UtilizationandRetainer Summary), sort by clicking the column headers and page through the results at the bottom; theProfitability Detail, by contrast, is laid out as expandable project groups with no column sorting. Then export with theCSVandPDFbuttons in the top-left.

Tips & edge cases
- The
Profitability Summaryswitches between grouping byClientand byProject; the table’s first column changes accordingly. - Margin and profit show in green when positive, red when negative — a quick visual flag for loss-making projects.
- In
Team Utilization, utilization targets 100% of capacity: 80% and up turns green, below 50% turns red. - For retainers, a
Utilization %above 100% and a positiveOverage Valueflag a retainer that’s over budget. - Without tracked time or expenses assigned to projects, costs and margins stay empty: profitability relies on that upstream data.
Frequently asked questions
What’s the difference between the Profitability Summary and Detail?
The Summary aggregates profitability by client or project (one row per entity). The Detail opens each project line by line (labor and expenses) so you can see exactly what makes up the profit.
How does InnoBooks calculate gross profit?
Gross profit is Revenue minus costs: labor cost (tracked hours valued at their rate) plus the cost of expenses assigned to the project. Gross margin % is that profit divided by revenue.
Why doesn’t the Profitability group appear in my reports?
All four reports require the profitability.read permission. Without it, the Profitability Reports group and its pages stay out of reach; ask an administrator for this permission.