

The InnoBooks dashboard brings together four key indicators —
Income,Expense,ProfitandOutstanding— above aRevenue and Expenseschart you filter by category, type, taxes and period, plus two pie chartsExpense by CategoryandRevenue by Client. Each selector works on its own, without leaving the page.
What you’ll need
- The
dashboard.readpermission to open theDashboardmenu entry. - The
dashboard.financial.readpermission to see the financial view (tiles and charts). Without it, InnoBooks shows the personal dashboard: hours this week, this month and upcoming tasks. - Invoices and expenses already entered, so the indicators and charts have data to display.
- Optional: the
stock.adjustment.readpermission to show theWaste & adjustmentssection at the bottom of the page.
Steps
- Open the dashboard and read the indicators
From the menu, open
Dashboard. At the top of the page, four tiles summarize your activity:Income(money in),Expense,Profit(Income − Expense) andOutstanding(invoices still due). These tiles are not affected by the chart filters.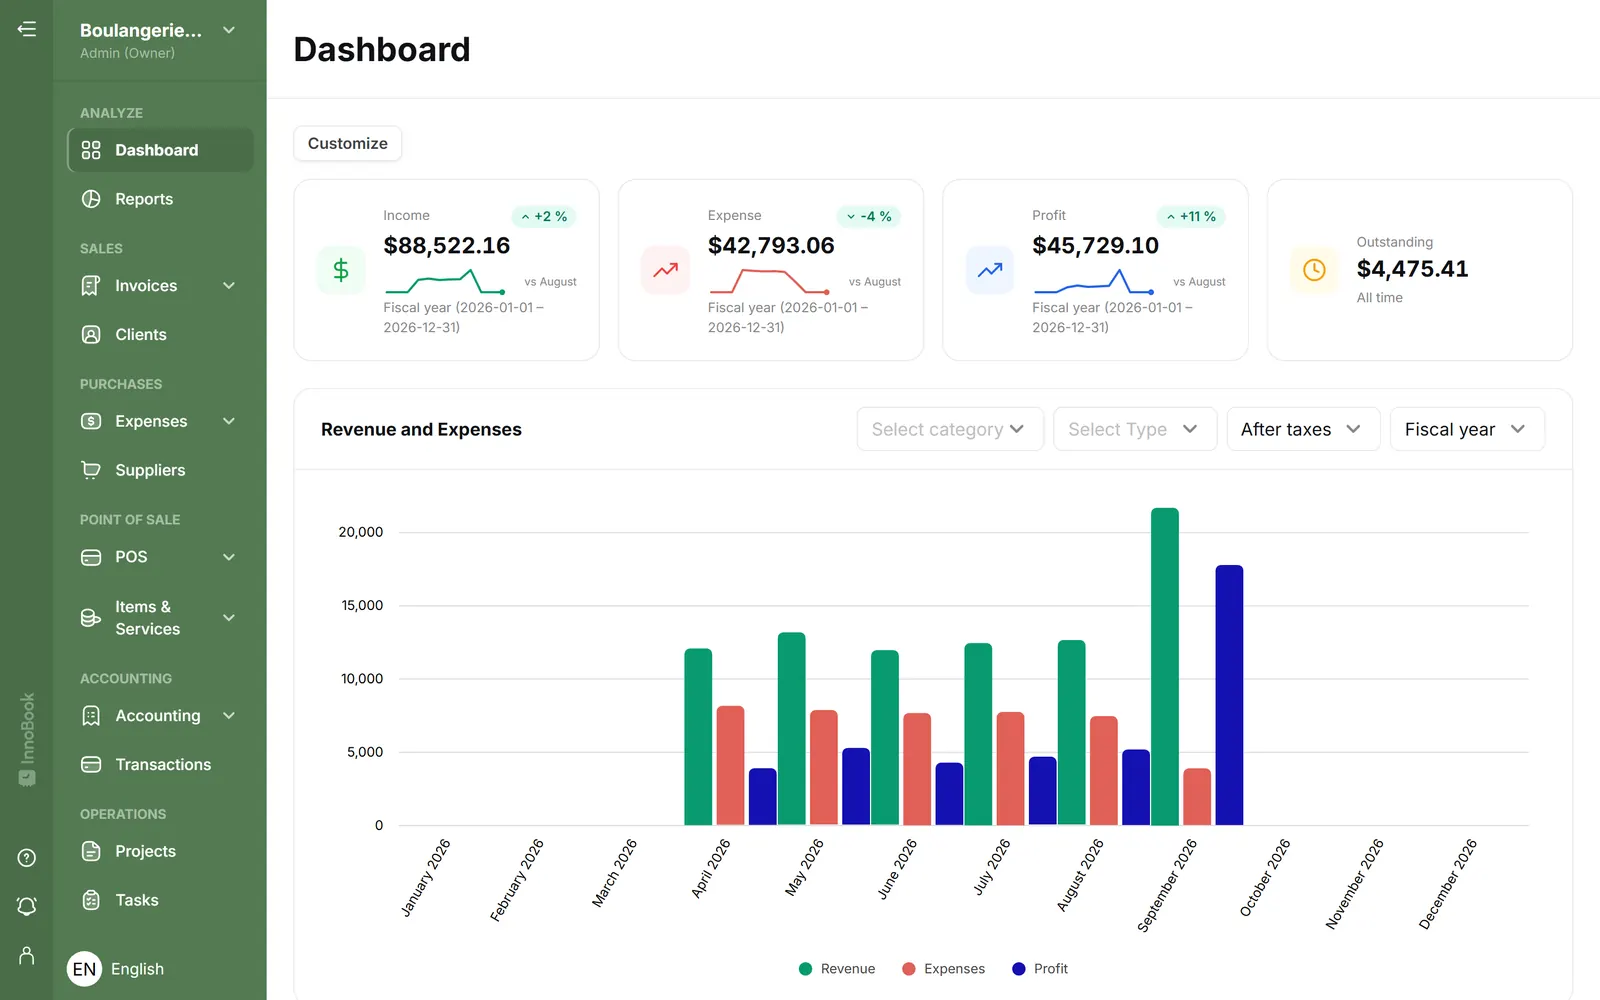
Dashboard banner with the four Income / Expense / Profit / Outstanding tiles and their colored icons. - Filter the Revenue and Expenses chart by category
Below the tiles, the
Revenue and Expenseschart shows three monthly series:Revenue(green),Expenses(red) andProfit(blue). Open theSelect categorypicker to keep only certain sub-categories: click one or several entries and the chart recalculates instantly. - Choose the data type
In the
Select Typemenu, chooseRevenue and Expenses(all three series),Invoice(revenue only) orExpense(costs only). In Invoice or Expense mode the chart shows a single series. - Switch before or after taxes
The tax filter (labelled
Tax Filter) offersAfter taxes(the default) andBefore taxes. “After taxes” includes the GST (5%) and QST (9.975%) collected and paid; “Before taxes” shows net amounts only. Pick one depending on whether you analyze real cash flow or your pre-tax margin. - Choose the period or fiscal year
The
Select Timepicker opens onFiscal yearby default. You can also chooseLast 6 months,Last 12 monthsor a specific calendar year (the current year and the four previous ones). The chart updates immediately. - Explore the category and client charts
Below the main chart, two pie charts round out the analysis:
Expense by Category(how your costs break down) andRevenue by Client(how your sales break down). Each has its ownSelect Timemenu, also set toFiscal yearto start; they are independent of the Revenue and Expenses chart.

Tips & edge cases
- The
Revenue and Expenseschart filters are independent of the two pie charts: each chart keeps its own period. - On load, every chart opens on
Fiscal yearand the main chart onAfter taxes. - The main chart stacks three series (Revenue, Expenses, Profit); switching to
InvoiceorExpensereduces it to a single series. - The
Waste & adjustmentssection appears below the charts only if your role hasstock.adjustment.read. - Without
dashboard.financial.read, the page automatically switches to the employee dashboard (hours and upcoming tasks): ask an administrator for this permission to get the financial view back.
Frequently asked questions
Why don’t I see the financial indicators?
The financial view (tiles and charts) requires the dashboard.financial.read permission. Without it, InnoBooks shows the personal dashboard: your hours this week, this month and your upcoming tasks. An administrator can adjust your role.
Which periods can I choose for the charts?
The Select Time menu offers Fiscal year, Last 6 months, Last 12 months, plus the current calendar year and the four previous ones. “Last month” is not offered for this chart.
What’s the difference between “Before taxes” and “After taxes”?
“After taxes” includes the GST (5%) and QST (9.975%); “Before taxes” shows net amounts only. Use “Before taxes” to compare margins and “After taxes” to match your real cash flow.